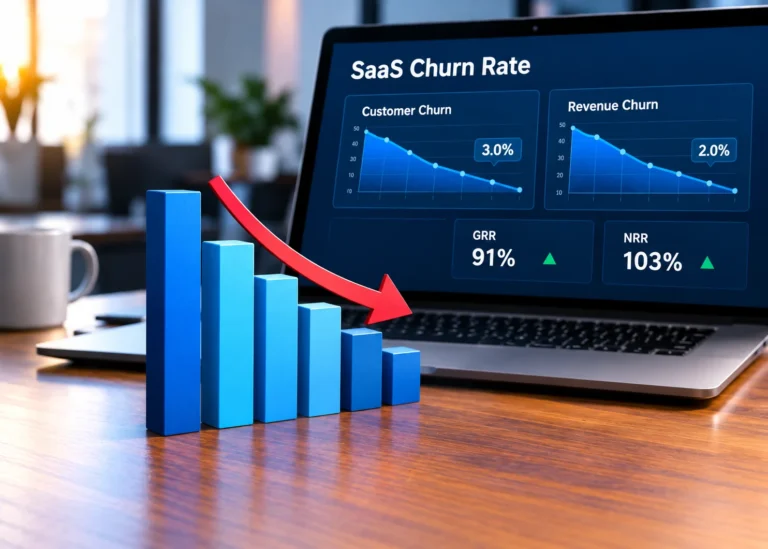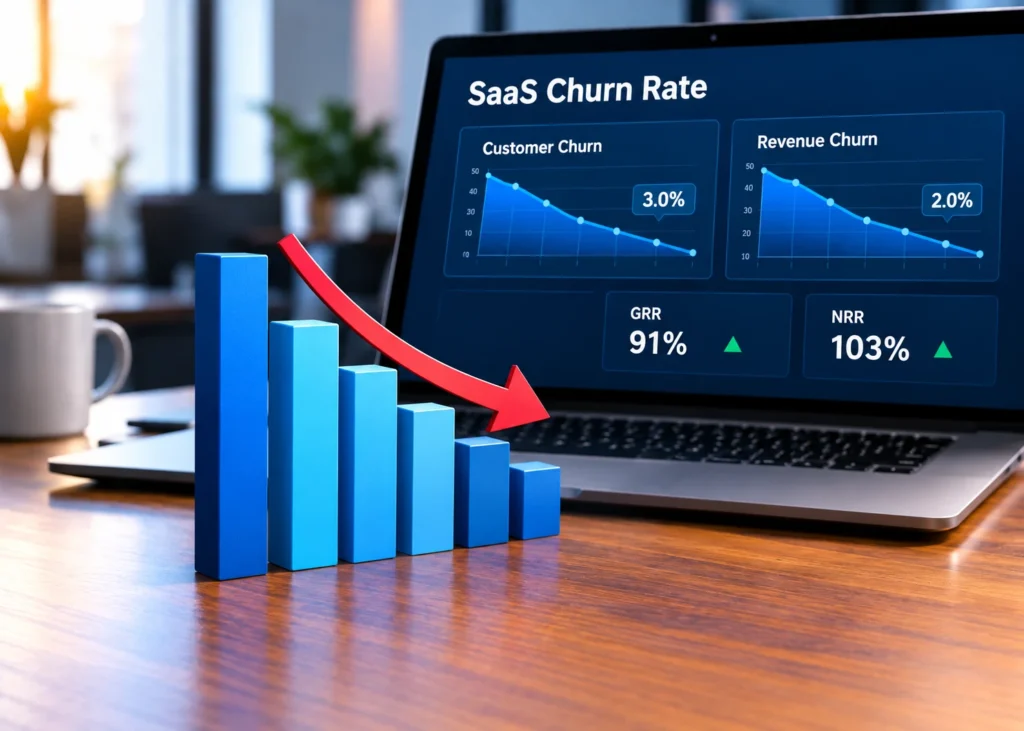
A single percentage point of monthly churn can swing a SaaS company’s valuation by millions once it compounds over 12 months. Recurly’s subscription benchmark data puts overall churn across its network of subscription businesses at 3.60% as of mid-2026, while SaaS Capital’s annual survey of more than 1,000 private B2B SaaS companies shows median net revenue retention holding at 103%. Those two numbers sound close, but they measure completely different things, and confusing them is one of the most common mistakes founders make when they try to fix retention.
This guide breaks down exactly how SaaS churn rate is calculated, what counts as a healthy number for your segment in 2026, why customers actually leave, and which reduction strategies produce measurable results. Every benchmark cited here traces back to a named source you can verify yourself.
Table of Contents
ToggleWhat Is SaaS Churn Rate?
SaaS churn rate measures the percentage of customers or revenue a company loses over a given period, usually a month or a year. It sounds like one number. In practice, it is at least four different numbers, and mixing them up leads to bad decisions.
Customer (Logo) Churn vs. Revenue Churn
Customer churn, often called logo churn, counts the percentage of paying accounts that cancel in a period. Revenue churn measures the percentage of recurring revenue lost instead. These two rarely match.
A company can lose 5% of its customers in a month while losing only 2% of revenue, because the customers who left were on small plans. That gap matters. A board that only tracks logo churn can miss a revenue problem building underneath a stable-looking customer count.
Voluntary vs. Involuntary Churn
Voluntary churn happens when a customer actively decides to cancel. Involuntary churn happens when a payment fails, a card expires, or a charge gets declined, and the subscription lapses without anyone choosing to leave.
Recurly’s 2025 industry research projected that failed payments could cost subscription companies more than $129 billion globally that year if left unmanaged. That is not a customer experience problem. It is a billing operations problem, and it is usually the cheapest one to fix.
Why Churn Matters More Than Acquisition Metrics for SaaS Valuation
Investors weight retention heavily because it predicts how efficiently a company can grow. Net Revenue Retention (NRR) above 120% lets a company grow meaningfully without adding a single new customer, according to the way Bessemer Venture Partners frames its Cloud Index benchmarks. A company below 100% NRR is shrinking from its existing base even before new sales are counted, which is the kind of structural issue that shows up in valuation multiples long before it shows up in a board deck.
How to Calculate SaaS Churn Rate
Customer Churn Rate Formula
Customer Churn Rate = (Customers Lost During Period / Customers at Start of Period) × 100
Example: A company starts the month with 500 customers and loses 15 by month’s end.
15 / 500 × 100 = 3% monthly customer churn.
Revenue Churn Rate Formula
Revenue Churn Rate = (MRR Lost During Period / MRR at Start of Period) × 100
Example: A company starts the month with $200,000 MRR and loses $6,000 in canceled or downgraded subscriptions.
6,000 / 200,000 × 100 = 3% monthly revenue churn.
This formula, on its own, ignores expansion revenue. That is intentional. Gross revenue churn should isolate what you lost, not net it against what you gained. Netting the two together is what NRR and GRR are for.
Gross Revenue Retention (GRR) vs. Net Revenue Retention (NRR)
GRR measures the percentage of revenue retained from a starting cohort, counting only churn and downgrades. It caps at 100%, since it never includes upsell revenue. NRR takes that same starting cohort and adds back expansion revenue (upsells, seat growth, cross-sells), which lets it exceed 100%.
GRR = (Starting MRR − Churned MRR − Contraction MRR) / Starting MRR × 100
NRR = (Starting MRR − Churned MRR − Contraction MRR + Expansion MRR) / Starting MRR × 100
SaaS Capital’s 2026 survey of bootstrapped private SaaS companies in the $3 million to $20 million ARR range found median GRR of 91% and median NRR of 103%, with the 90th percentile reaching 100% GRR and 117.9% NRR. That gap between median and top-decile performance is almost entirely expansion revenue, not lower churn.
Monthly vs. Annual Churn: How to Convert Between Them
Monthly and annual churn are not simply multiplied by 12, because churn compounds. The conversion formula is:
Annual Churn Rate = 1 − (1 − Monthly Churn Rate)^12
A steady 5% monthly churn rate does not equal 60% annual churn. It compounds to roughly 46%, because each month’s churn applies to a shrinking base. This is why a company with what feels like a manageable monthly number can be losing nearly half its customer base annually without anyone noticing until the year-end review.
Common Calculation Mistakes
- Mixing cohorts, such as blending churn from a legacy pricing tier with churn from a new self-serve plan
- Reporting gross churn as if it were net churn, which overstates how much trouble the business is in
- Using the wrong denominator, calculating against end-of-period customers instead of start-of-period customers
- Averaging monthly churn to estimate an annual figure instead of compounding it
What Is a Good SaaS Churn Rate in 2026?
There is no single healthy number. Churn benchmarks depend heavily on customer segment, contract length, and vertical, and blending them into one average is one of the most common ways SaaS content gets this topic wrong.
Benchmarks by Customer Segment
Recurly’s subscription benchmark data separates B2B from B2C churn behavior. Voluntary churn for B2B software sits at roughly 3.36% monthly, compared with about 4% for B2C software, with involuntary churn adding roughly another 1.19 and 1.70 percentage points respectively. Vena’s 2025 industry analysis reports a broader average annual SaaS churn rate near 3.8%, rising to about 4.9% annually when isolating B2B SaaS specifically.
The consistent pattern across these sources is that enterprise and longer-contract segments churn slower than self-serve, monthly-billed segments, because annual contracts create a natural friction point that monthly plans do not.
Benchmarks by Growth Stage and Retention Metric
| Metric | Benchmark | Source |
| Median NRR, bootstrapped B2B SaaS (3M–20M ARR) | 103% | SaaS Capital 2026 survey |
| 90th percentile NRR, same cohort | 117.9% | SaaS Capital 2026 survey |
| Median GRR, same cohort | 91% | SaaS Capital 2026 survey |
| Public SaaS median NRR | ~105–115% | Meritech / Public Comps / Bessemer, 2025–2026 |
| Bessemer NRR quality bar | 100% good, 110% better, 120%+ best | Bessemer State of the Cloud |
| B2B software voluntary monthly churn | ~3.36% | Recurly subscription benchmarks |
| B2B SaaS annual churn | ~4.9% | Vena 2025 analysis |
Why Vertical Changes the Healthy Number
A payroll platform with deep integrations and high switching costs will naturally churn slower than a project management tool competing against a dozen close substitutes. Rather than benchmarking against an industry-wide average, compare your churn to companies with a similar contract length, average deal size, and switching cost. A 5% monthly churn rate might be a five-alarm fire for an enterprise infrastructure vendor and an entirely normal Tuesday for a low-cost, self-serve tool with no lock-in.
Why SaaS Customers Actually Churn
Product and Onboarding Failures
Customers who never reach their first meaningful outcome with a product rarely stick around long enough to become advocates. If a user signs up, gets confused during setup, and never activates a core feature, the eventual cancellation was decided in week one, not in month three when it shows up in the churn report.
Poor Customer Success Coverage
Reactive support that only engages after a cancellation request is already too late. Proactive customer success, built around usage-based health scores rather than gut feel, catches at-risk accounts while there is still time to intervene.
Pricing and Packaging Mismatches
Customers downgrade or cancel when they feel they are paying for capacity they do not use, or when a competitor packages the same value at a lower entry price. This shows up as contraction churn well before it shows up as full cancellation.
Payment Failures and Involuntary Churn
This is the churn category most companies underinvest in fixing, despite it being the most mechanical to solve. Expired cards, failed authorizations, and lapsed billing details account for a substantial share of subscription cancellations that had nothing to do with product dissatisfaction.
Competitive Displacement and Vendor Consolidation
As IT and procurement teams tighten budgets, many organizations are actively reducing the number of vendors they pay for, folding point solutions into platforms they already own. A product can be well liked and still get cut in a consolidation review if it is not deeply embedded in a customer’s workflow.
How to Reduce SaaS Churn Rate: Proven Strategies
Fix Involuntary Churn First
Before touching onboarding flows or customer success playbooks, audit your dunning and payment recovery setup. Automated retry logic, updated card detection through your payment processor, and a multi-touch dunning email sequence recover revenue that would otherwise be written off as a customer choice when it was really a billing failure. This is typically the highest return-on-effort fix available, since it requires no product changes and no additional headcount, only a properly configured billing stack.
Redesign Onboarding Around Time-to-Value
Map the shortest realistic path between signup and the moment a customer experiences the product’s core value. Every extra step, form field, or configuration screen between those two points is a place churn risk accumulates. Onboarding should be measured by time-to-first-value, not by how many features get demoed.
Build a Proactive Customer Success Motion
- Define account health scores using actual product usage data, not renewal date proximity
- Trigger outreach when usage drops below a defined threshold, not after a cancellation email arrives
- Run structured quarterly business reviews for mid-market and enterprise accounts to surface expansion opportunities and renewal risk in the same conversation
Use Win-Back and Cancellation Flows Correctly
A cancellation flow should ask why someone is leaving before it tries to save them, and the save offer should match the actual reason given. Offering a discount to someone leaving because a feature does not exist yet wastes the offer and misses the real signal.
Align Pricing and Packaging to Reduce Downgrade Churn
Review contraction churn separately from cancellation churn. If customers regularly downgrade rather than cancel outright, that is a signal your packaging tiers do not match how customers actually grow into, or out of, the product.
Treat NRR as the North Star, Not Just Logo Retention
A company can lose a meaningful percentage of small accounts every month and still post NRR above 110% if its remaining accounts expand fast enough. That does not mean logo churn is irrelevant, but net revenue retention is the more complete signal of business health, because it captures both the leak and the growth happening on top of it.
SaaS Churn Analytics and Retention Platforms Worth Knowing
The following overview is based on each company’s own public positioning, feature pages, and third-party comparison data from sources like G2 and GetApp. None of this reflects first-hand implementation, and pricing or feature sets should be verified directly with each vendor before a purchase decision, since SaaS pricing pages change frequently.
| Tool | Core Use Case | Churn-Relevant Features | Best Fit |
| ChartMogul | Subscription analytics from billing data | One-click MRR, churn, and LTV calculation from Stripe, Braintree, Chargify, or Recurly; multiple selectable churn formulas | Finance and RevOps teams that want billing-native metrics without manual spreadsheet work |
| Baremetrics | Subscription analytics and insights | MRR movement broken out by new, expansion, reactivation, and churned revenue; customer-level activity timeline | Founders who want to see not just that churn happened but why, at the individual account level |
| Vitally | Customer success platform | Health scoring, playbook automation, AI-assisted workflow drafting for CS teams | Mid-market SaaS companies building a dedicated customer success motion |
| ChurnZero | Account-based customer success | In-app customer messaging, automated health scoring, renewal workflow tracking | Teams that want customer success and in-app engagement in one system |
For involuntary churn specifically, billing platforms like Recurly and Chargebee publish dedicated dunning and payment recovery tooling, since that function usually lives in the billing layer rather than the customer success layer.
Building a Churn Reduction Roadmap
Step 1: Audit Your Real Numbers
Separate logo churn from revenue churn, and voluntary from involuntary, before setting any reduction target. A single blended churn number cannot tell you which lever to pull.
Step 2: Segment Churn by Cohort and Reason
Break churn down by signup cohort, plan tier, and stated cancellation reason. Patterns that are invisible in an aggregate monthly number often become obvious once segmented.
Step 3: Prioritize the Highest-Leverage Fix
For most companies, that is involuntary churn recovery, since it requires no behavioral change from the customer, only better billing infrastructure. Onboarding and customer success fixes usually come next, since they take longer to show results.
Step 4: Set a 90-Day Measurement Cadence
Churn interventions need time to show up in the data. A 90-day review cycle balances giving a fix enough time to work against the risk of a small problem compounding for too long unnoticed.
Frequently Asked Questions About SaaS Churn Rate
What is a SaaS churn rate?
SaaS churn rate is the percentage of customers or recurring revenue a company loses over a set period, typically a month or a year. It can be measured as customer churn or revenue churn, and each tells a different story about business health, since large and small accounts do not affect each metric equally.
How do you calculate SaaS churn rate?
Divide the number of customers, or the amount of MRR, lost during a period by the number of customers or MRR at the start of that period, then multiply by 100. Always confirm whether you are calculating customer churn or revenue churn, since the two use different inputs and rarely match.
What’s the difference between customer churn and revenue churn?
Customer churn counts canceled accounts as a percentage of total accounts. Revenue churn counts lost MRR as a percentage of starting MRR. A company can have high customer churn but low revenue churn if the accounts that left were on small plans, or the reverse if a few large accounts leave.
What is a good SaaS churn rate in 2026?
It depends on segment. Recurly’s benchmark data puts B2B software voluntary churn near 3.36% monthly, while SaaS Capital’s 2026 survey shows median NRR of 103% for bootstrapped companies. Enterprise and annual-contract businesses generally churn slower than self-serve, monthly-billed products.
What’s the difference between gross and net revenue retention?
Gross revenue retention measures revenue kept after churn and downgrades, capped at 100%. Net revenue retention adds expansion revenue back in and can exceed 100%. SaaS Capital’s 2026 data shows median GRR of 91% against median NRR of 103% for the same company cohort.
Why is involuntary churn often the fastest churn fix?
Involuntary churn comes from payment failures, not customer dissatisfaction. Recurly’s 2025 research projected over $129 billion in potential losses industry-wide from unmanaged failed payments. Fixing dunning and payment retry logic recovers this revenue without any product or pricing changes.
How often should SaaS companies measure churn?
Monthly measurement is standard for tracking trends, but meaningful strategy changes need at least a 90-day window to show results. Reviewing churn weekly without giving fixes time to work usually leads to reactive, low-impact changes.
Does churn rate differ by industry vertical?
Yes, significantly. Products with high switching costs and deep integrations, like infrastructure or payroll software, tend to churn slower than lower-cost, easily substitutable tools. Benchmarking against your specific vertical and contract length matters more than comparing to an industry-wide average.
What causes most SaaS customer churn?
The leading causes are failed onboarding that never reaches a first meaningful outcome, reactive rather than proactive customer success, pricing or packaging mismatches, and involuntary churn from payment failures. Each requires a different fix, which is why segmenting churn by cause matters before choosing a strategy.
Can a SaaS company have negative churn?
Yes, in the sense that net revenue retention can exceed 100%, meaning expansion revenue from existing customers outpaces what was lost to churn and downgrades. Companies describing negative net churn are referring to this NRR-above-100% scenario, not an actual absence of customer cancellations.
Conclusion
SaaS churn rate is not one metric. It is a family of related numbers, logo churn, revenue churn, voluntary and involuntary churn, GRR and NRR, and treating them as interchangeable is how good-looking dashboards hide real retention problems. The benchmarks worth anchoring to in 2026 come from named, checkable sources: Recurly’s subscription data, SaaS Capital’s private company survey, and Bessemer’s public market retention framework, not blended averages from unattributed industry reports.
The companies making real progress on churn in 2026 are not chasing a single target number. They are separating their churn by cause, fixing the mechanical problems like failed payments first, and treating net revenue retention as the metric that actually predicts where the business is headed.