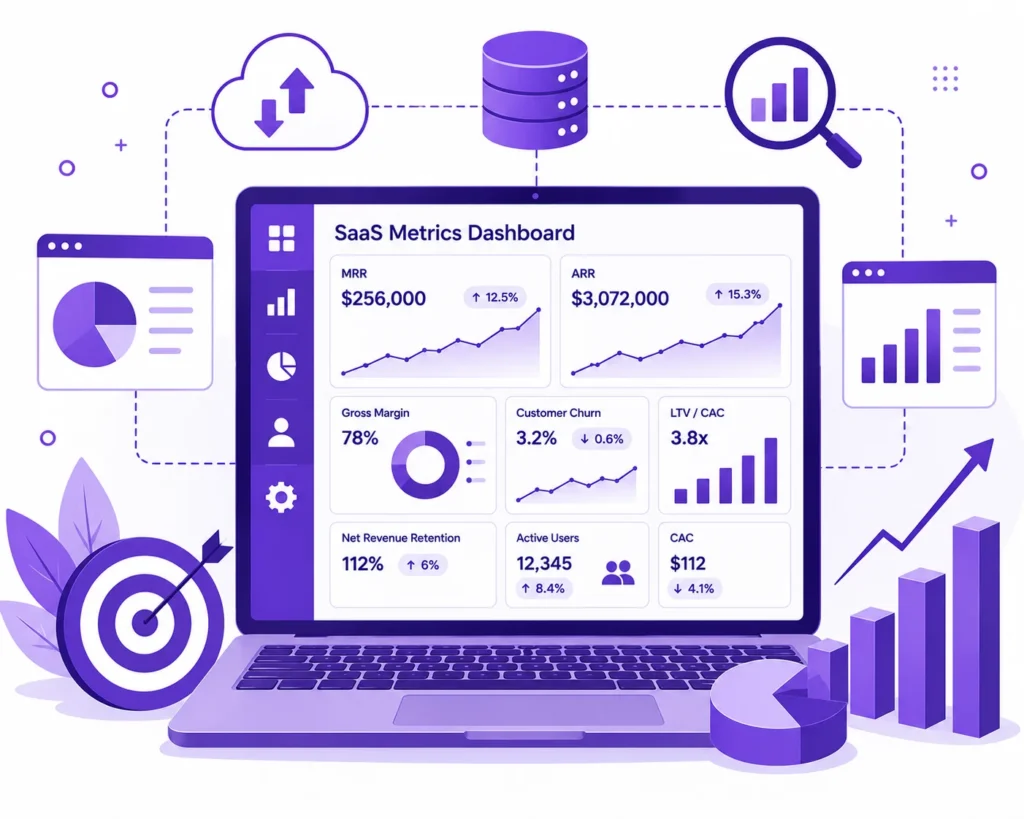
Running a SaaS business without tracking the right metrics is like driving with no dashboard. According to Statista, the global Software as a Service (SaaS) market is projected to generate nearly US$489 billion in revenue in 2026, reflecting the continued growth of subscription-based software worldwide. As competition increases, revenue growth alone isn’t enough. Without visibility into customer acquisition costs, retention, profitability, and product engagement, it’s difficult to know whether that growth is sustainable.
The most successful SaaS companies don’t rely on a single KPI. Instead, they monitor a balanced set of financial, sales, marketing, and customer success metrics that reveal what’s working, where revenue is leaking, and which areas need attention. Investors also use these numbers to evaluate business health, making them just as important for fundraising as they are for day-to-day decision-making.
Table of Contents
ToggleWhat Are SaaS Metrics?
SaaS metrics are the specific numbers a subscription software business tracks to measure its financial health, growth efficiency, and customer experience. Unlike a traditional one time sale, a SaaS company earns revenue in small recurring increments over the life of a customer relationship, which means the usual measures of business health, like total revenue or unit sales, do not tell the full story on their own.
That is why SaaS companies rely on a distinct set of SaaS KPIs built around recurring revenue, retention, and unit economics instead. A metric like MRR shows how much predictable revenue exists right now, CAC and LTV show whether each new customer is worth what it costs to acquire them, and NRR shows whether the existing customer base is expanding or quietly shrinking. Together, these SaaS performance metrics give founders, finance teams, and investors a shared, comparable way to judge whether a subscription business is actually compounding or just growing on the surface.
Financial Metrics
Financial metrics are the foundation of every SaaS business metrics dashboard. They tell you how much recurring revenue you generate, how efficiently you generate it, and whether your subscription revenue is actually sustainable.
1. MRR (Monthly Recurring Revenue)
Monthly Recurring Revenue (MRR) is the normalized monthly value of every active subscription on your books. It strips out one time fees, add on charges that do not recur, and anything that would distort the true run rate of the business.
Formula: MRR = Number of paying customers x Average revenue per customer (per month)
MRR gives founders and finance teams a single number to track week over week instead of waiting for a quarterly close. Most SaaS dashboards break MRR into new MRR, expansion MRR, contraction MRR, and churned MRR so you can see exactly where growth comes from and where it leaks out. A healthy subscription business grows new and expands MRR faster than it loses ground to contraction and churn, and that balance is really the whole story of recurring revenue growth.
2. ARR (Annual Recurring Revenue)
Annual Recurring Revenue (ARR) is simply MRR multiplied by 12. It is the number that shows up on pitch decks, board slides, and valuation conversations because it maps cleanly to the annual planning cycles that investors think in.
Formula: ARR = MRR x 12
ARR only tells a useful story when it sits next to growth rate, churn, and margin. A company at $10 million ARR growing 15 percent a year with heavy churn is in a very different position than one at the same ARR growing 40 percent with strong retention, even though the headline number looks identical. Use ARR as the anchor metric on your SaaS dashboard, then layer everything else on top of it.
Example: Public SaaS companies like Salesforce frequently report Annual Recurring Revenue (ARR) as a core business metric because it provides investors with a clear view of predictable subscription revenue and long-term growth.
Read also over blog : The 10 Best SaaS Demand Generation Agencies in 2026
3. Gross Margin
Gross margin measures how much revenue is left after paying for the direct cost of delivering your software, things like hosting, infrastructure, third party API costs, and customer support tied directly to service delivery.
Formula: Gross Margin = (Revenue – Cost of Goods Sold) / Revenue x 100
Gross margin benchmarks vary by segment. SMB focused SaaS companies typically run 60 to 70 percent gross margins because support costs eat a larger share of smaller contracts, mid market products land around 70 to 80 percent, and enterprise SaaS companies often reach 80 to 85 percent thanks to lower relative support costs per dollar of revenue. Public SaaS gross margins have compressed somewhat in 2026 as AI inference costs get baked into infrastructure spend, which makes a company still running 75 percent or higher gross margin look genuinely strong rather than average.
4. Customer Churn Rate
Customer Churn Rate, sometimes called logo churn, tracks the percentage of paying accounts that cancel in a given period. It answers a simple question: how many of the customers you had at the start of the month are gone by the end of it.
Formula: Customer Churn Rate = (Customers Lost in Period / Customers at Start of Period) x 100
An annual logo churn rate under 5 percent is generally treated as healthy for an established B2B SaaS company, though smaller and SMB focused products often run considerably higher, sometimes in the 10 to 15 percent annual range, because their end customers face higher business failure rates in the first place. Monthly churn in the 3 to 5 percent range is common across the broader market, and a meaningful share of that, often 20 to 40 percent, comes from involuntary churn like failed card payments rather than customers actively deciding to leave. Fixing failed payment recovery through retry logic and dunning emails is frequently the fastest churn reduction win available to any team.
5. Revenue Churn Rate
Revenue churn rate, also called dollar churn or MRR churn, measures the percentage of recurring revenue lost to cancellations and downgrades, independent of how many logos left.
Formula: Revenue Churn Rate = (MRR Lost from Cancellations + Downgrades) / MRR at Start of Period x 100
This distinction matters because a business can report low customer churn while quietly bleeding revenue if the accounts leaving happen to be the larger ones. Median gross dollar churn across the broader SaaS market sits around 12 percent annually, though the healthiest companies push it into negative territory. Negative revenue churn happens when expansion revenue from upsells and seat growth outpaces what you lose to cancellations and downgrades, and it is one of the clearest signs of durable subscription revenue.
Example: Slack reduced revenue churn by expanding within existing organizations. As more employees adopted the platform, subscription revenue often grew even without acquiring new customers, demonstrating the power of expansion revenue.
6. Rule of 40
The Rule of 40 combines revenue growth rate and profit margin into a single efficiency score. A healthy SaaS company should see the two add up to 40 percent or more, whether through high growth with thinner margins, moderate growth with solid profitability, or some balance between the two.
Formula: Rule of 40 Score = Revenue Growth Rate (%) + Profit Margin (%)
According to the 2026 Aleph x Benchmarkit SaaS Performance Benchmarks report, the median B2B SaaS company posted a Rule of 40 score of just 25 percent in 2025, up from 15 percent the year before, the largest single year jump in five years of benchmark data. Top quartile companies clear 43 percent. The 40 percent bar has not moved, but more companies are closer to it now than at any point since 2022, largely because margins have held up even as growth rates slowed across the sector.
Marketing & Acquisition Metrics
These are the SaaS KPIs that tell you whether your go to market motion is spending money efficiently or just spending money.
7. CAC (Customer Acquisition Cost)
Customer Acquisition Cost (CAC) captures the fully loaded cost of winning a new paying customer, including ad spend, sales salaries, commissions, marketing tools, and agency fees.
Formula: CAC = Total Sales & Marketing Spend / Number of New Customers Acquired
Rising ad platform costs have pushed CAC higher across the board heading into 2026, with average B2B CAC estimates ranging widely depending on the dataset and business model. What matters more than the raw number is tracking CAC by channel and by customer segment rather than relying on one blended figure, since a single average can hide a channel that is quietly burning budget with nothing to show for it. If you want a deeper look at how acquisition spend fits into a broader go to market plan, our guide on digital marketing strategies for SaaS companies breaks down channel selection in more detail.
8. LTV / CLV (Customer Lifetime Value)
Customer Lifetime Value (LTV or CLV) estimates the total gross margin a customer generates over the life of their subscription. It is the number that CAC gets measured against.
Formula: LTV = (Average Revenue Per Account x Gross Margin %) / Monthly Churn Rate
A common mistake here is calculating LTV off raw revenue instead of gross margin adjusted revenue, which can overstate the number by 30 percent or more. Include expansion revenue where possible by using net churn instead of gross churn, since a customer who upgrades twice before eventually leaving is worth meaningfully more than the base contract value suggests. Reducing churn tends to move LTV further than increasing average revenue per account or improving gross margin, because churn compounds over every remaining month of the relationship.
9. LTV:CAC Ratio
The LTV:CAC ratio puts customer lifetime value and acquisition cost side by side to answer one question: does the business earn back more than it spends to win each customer, and by how much.
Formula: LTV:CAC Ratio = LTV / CAC
A ratio of 3:1 is the widely cited floor for a sustainable B2B SaaS business, and the 2026 median across B2B SaaS sits close to 3.2:1, with top quartile companies reaching 4:1 to 6:1. Early stage companies under $2 million ARR can reasonably run at 2:1 to 3:1 while they are still proving the model, growth stage companies between $2 million and $10 million ARR should aim for 3:1 to 4:1, and companies scaling past $10 million ARR typically target 4:1 or higher. A ratio above 5:1 is not automatically a good sign either, since it can point to underinvestment in growth rather than unusually strong unit economics.
10. CAC Payback Period
CAC payback period tells you how many months it takes to recover the cost of acquiring a customer purely from the gross margin that customer generates. It is a cash flow metric more than a profitability metric.
Formula: CAC Payback Period = CAC / (Monthly Revenue Per Customer x Gross Margin %)
According to the Benchmarkit 2025 dataset, median B2B SaaS CAC payback sits around 15 to 16 months, up from roughly 14 months just a couple of years earlier as channel costs climbed. A payback period under 12 months is generally considered strong, and elite performers recover CAC in 6 months or less. Payback varies sharply by deal size too, with self-serve SMB products often recovering costs in 8 to 12 months while enterprise contracts with long sales cycles can stretch past 18 to 24 months, a gap that a healthy expansion motion is meant to close over time.
Sales & Customer Growth Metrics
This group covers the SaaS sales metrics and retention numbers that investors now weigh as heavily as raw growth rate, sometimes more heavily.
11. NRR (Net Revenue Retention)
Net Revenue Retention (NRR) measures how much recurring revenue an existing customer base generates over time, including expansion, downgrades, and churn, but excluding any revenue from new logos.
Formula: NRR = (Starting MRR + Expansion – Contraction – Churn) / Starting MRR x 100
Benchmarks vary depending on the dataset, but private B2B SaaS NRR generally clusters in the 100 to 108 percent range at the median in 2026, with enterprise focused companies frequently reaching 115 to 120 percent and SMB focused companies often sitting at or below 100 percent. McKinsey’s analysis of over 100 B2B SaaS companies found that top quartile NRR performers traded at a median enterprise value to revenue multiple many times higher than bottom quartile peers, which is a striking reminder that Net Revenue Retention (NRR) has become as important to valuation conversations as growth rate itself. NRR above 110 to 120 percent means your existing customers are growing the business on their own, without a single new sale.
Example: HubSpot has consistently highlighted Net Revenue Retention (NRR) as an indicator of customer expansion. High NRR shows that existing customers continue upgrading plans, purchasing additional products, or increasing usage over time, reducing dependence on acquiring new customers.
12. Customer Retention Rate
Customer retention rate is the mirror image of churn. It tells you what percentage of your customer base you kept over a given period, and it directly feeds customer loyalty and long term account value.
Formula: Customer Retention Rate = ((Customers at End of Period – New Customers Acquired) / Customers at Start of Period) x 100
Well run B2B SaaS businesses typically hold annual retention around 88 to 90 percent, though this varies by segment and pricing tier. Retention rate and NRR tell related but different stories: retention counts accounts, NRR counts dollars, and a business can hold strong logo retention while still leaking revenue if the accounts that churn happen to be its larger contracts. If you are evaluating tools to help manage renewals and account health at scale, our roundup of the best account management software covers platforms built specifically for tracking retention at the account level.
Example: During the rise of remote work, Zoom’s ability to retain business customers became a major growth driver. Strong retention allowed the company to generate recurring revenue even after the surge in new customer acquisition slowed.
13. Sales Velocity
Sales velocity measures how quickly your sales pipeline turns into revenue. It combines four inputs into a single dollar per day figure that shows whether your funnel is speeding up or slowing down.
Formula: Sales Velocity = (Number of Qualified Opportunities x Win Rate x Average Deal Size) / Sales Cycle Length
Sales velocity is one of the more underused SaaS growth metrics because it forces a team to look at all four levers together instead of optimizing one in isolation. A team that doubles its opportunity count while win rate quietly drops in half has not actually improved anything, and sales velocity is the number that catches that kind of hidden tradeoff before it shows up in a missed quarter.
14. Magic Number
The Magic Number measures sales and marketing efficiency by comparing net new annual recurring revenue against the sales and marketing spend that generated it in the prior quarter.
Formula: Magic Number = (Net New ARR x 4) / Prior Quarter Sales & Marketing Spend
A Magic Number above 1.0 has traditionally signaled that a company is ready to invest more aggressively in sales and marketing, since it means each dollar spent is generating more than a dollar of new ARR on an annualized basis. In practice, 2026 benchmark data shows the median SaaS company spending closer to $2.00 in sales and marketing for every $1.00 of new ARR, which puts the typical Magic Number below 0.6, a meaningful drop in growth efficiency compared to a few years ago and a big part of why investors now scrutinize this number alongside CAC payback and Rule of 40.
Product & Customer Success Metrics
The last two metrics measure whether customers actually experience value from your product, which is ultimately what drives every financial number above it.
15. Product Activation Rate
Product activation rate tracks the percentage of new users or accounts that reach a meaningful “aha moment” in your product, the point where they experience the core value your software is built to deliver.
Formula: Product Activation Rate = (Users Who Complete Activation Event / Total New Users) x 100
According to Userpilot’s 2025 survey of over 500 SaaS companies, the aggregate median activation rate sits around 37.5 percent, but the spread across verticals is enormous, ranging from roughly 55 percent for AI and ML products down to single digits for complex fintech and insurance platforms. That range matters because comparing your activation rate to the wrong peer group leads to false confidence or false alarm. Segment targets tend to run 35 to 50 percent for SMB products, 40 to 55 percent for mid market, and 50 to 65 percent for enterprise, and strong user onboarding design is usually the single biggest lever for moving this number, well ahead of feature additions.
Example: Atlassian focuses heavily on product activation through self-service onboarding. By helping new users quickly create projects, invite teammates, and experience the product’s core value, the company improves activation rates and encourages long-term adoption.
16. NPS (Net Promoter Score)
Net Promoter Score (NPS) asks customers a single question, how likely are they to recommend your product to a colleague, and turns the answers into a score between negative 100 and positive 100 based on the split between promoters and detractors.
Formula: NPS = % Promoters – % Detractors
A score above 30 is generally considered strong across industries, above 50 is excellent, and above 70 is considered world class, though very few companies in any category reach that level. B2B SaaS specifically clusters around 30 to 41 at the median depending on the survey source, which is a touch lower than B2C software but still a meaningful signal when tracked consistently over time. Companies scoring above 50 NPS frequently report annual churn rates well under 5 percent, which is a good reminder that customer satisfaction and financial retention are two views of the same underlying relationship.
Read also over blog : 7 Best OKR SaaS Tools for Startups and Growing Businesses
Your 2026 SaaS Metrics Cheat Sheet
| Metric | Formula | 2026 Benchmark |
| MRR | Customers x Avg Revenue per Customer | Track monthly, watch the mix of new, expansion, and churned MRR |
| ARR | MRR x 12 | Pair with growth rate and NRR for context |
| Gross Margin | (Revenue – COGS) / Revenue | 60 to 70% SMB, 70 to 80% mid market, 80 to 85% enterprise |
| Customer Churn Rate | Customers Lost / Customers at Start | Under 5% annual is healthy for established B2B SaaS |
| Revenue Churn Rate | MRR Lost / Starting MRR | Median around 12% gross; negative is the goal |
| Rule of 40 | Growth Rate % + Profit Margin % | Median 25% in 2025, target 40%+ |
| CAC | S&M Spend / New Customers | Track by channel, not blended |
| LTV / CLV | (ARPA x Gross Margin) / Churn Rate | Use margin adjusted revenue, not raw revenue |
| LTV:CAC Ratio | LTV / CAC | 3:1 minimum, 4:1 to 6:1 top quartile |
| CAC Payback Period | CAC / (Monthly Revenue x Gross Margin) | 15 to 16 months median, under 12 is strong |
| NRR | (Start MRR + Expansion – Contraction – Churn) / Start MRR | 100 to 108% median, 115%+ is strong |
| Customer Retention Rate | (End Customers – New Customers) / Start Customers | 88 to 90% annual for healthy B2B SaaS |
| Sales Velocity | (Opportunities x Win Rate x Deal Size) / Cycle Length | Compare quarter over quarter, not in isolation |
| Magic Number | (Net New ARR x 4) / Prior Quarter S&M Spend | Above 1.0 signals efficient spend, median under 0.6 |
| Product Activation Rate | Activated Users / Total New Users | 37.5% aggregate median, varies widely by vertical |
| NPS | % Promoters – % Detractors | 30+ strong, 50+ excellent, 36 median for B2B SaaS |
SaaS Metrics by Company Stage
A “good” number for one of these metrics depends heavily on how far along the company is. Applying a scale stage benchmark to an early stage company, or the other way around, is one of the fastest ways to draw the wrong conclusion from a right number.
| Metric | Early Stage (under $5M ARR) | Growth Stage ($5M-$25M ARR) | Scale Stage (above $25M ARR) |
| LTV:CAC Ratio | 2:1 to 3:1 is acceptable while proving the model | 3:1 to 4:1 target | 4:1 to 5:1 or higher |
| CAC Payback Period | Bootstrapped teams often run under 5 months; funded seed and Series A closer to 10 to 12 months | 14 to 18 months typical | Enterprise motions can stretch to 18 to 24 months |
| NRR | 95 to 115 percent | 105 to 125 percent | 110 to 135 percent |
| Rule of 40 | Less meaningful before roughly $20M ARR, prioritize growth and product fit first | Becomes a real board metric | Expected benchmark for fundraising and exit conversations |
Tools to Track These Metrics
These 16 metrics generally pull from four categories of tooling rather than one single platform.
- Billing and subscription management platforms capture the raw data behind MRR, ARR, customer churn rate, and revenue churn rate directly from the payment ledger.
- CRM and sales pipeline tools feed sales velocity, CAC, and the inputs behind the Magic Number, since they track opportunity counts, win rates, and deal size.
- Product analytics platforms measure product activation rate, feature adoption, and the broader user engagement data that activation rate depends on.
- Customer success and survey tools run NPS and CSAT pulses and often surface early retention risk before it shows up in the churn numbers.
- A BI or dashboarding layer on top of all three is what turns 16 separate numbers into one unified SaaS dashboard instead of four disconnected systems that nobody checks together.
Read also over blog : Top 7 SaaS PR Agencies for B2B SaaS Companies in 2026
How Often to Review Each Metric
Not every metric belongs in the same meeting. Matching review cadence to how fast a number actually moves keeps teams from either missing a problem or wasting time on a number that has not changed since last week.
| Cadence | Metrics to Review |
| Weekly | MRR movement, CAC by channel, sales velocity, pipeline health |
| Monthly | Customer churn rate, revenue churn rate, product activation rate, NPS pulse surveys |
| Quarterly | NRR, LTV:CAC ratio, CAC payback period, Magic Number, customer retention rate |
| Annually or at board level | ARR, gross margin trend, Rule of 40 |
Common Mistakes When Tracking SaaS Metrics
A few errors show up again and again in SaaS reporting, and each one quietly distorts every metric downstream of it.
- Calculating LTV off raw revenue instead of gross margin adjusted revenue. This alone can overstate LTV by 30 percent or more and makes the LTV:CAC ratio look far healthier than it actually is.
- Blending CAC across every channel into one average. A single blended number hides the one channel that is quietly burning budget with nothing to show for it. Track CAC by channel and by customer segment.
- Confusing logo churn with revenue churn. A business can report low customer churn while its largest accounts are the ones walking out the door, which only shows up in revenue churn, not customer churn.
- Ignoring involuntary churn. Failed card payments account for a meaningful share of total churn in most SaaS businesses, and it is usually the cheapest churn to fix through retry logic and dunning emails.
- Applying a blended market benchmark instead of a stage appropriate one. A seed stage company measuring itself against a scale stage NRR benchmark will either panic unnecessarily or feel falsely confident.
- Excluding expansion revenue from LTV and NRR calculations. Both metrics understate the real value of a customer relationship when they only account for the base contract and ignore upsells and seat growth.
Frequently Asked Questions
What are SaaS metrics?
SaaS metrics are the quantitative measures that track the financial health, growth efficiency, and customer experience of a subscription software business. They span revenue metrics like MRR and ARR, unit economics like CAC and LTV, retention metrics like NRR and churn rate, and product metrics like activation rate.
Why are SaaS metrics important?
They give founders, operators, and investors a shared language for evaluating whether a subscription business is growing sustainably. A company can look impressive on revenue alone while quietly losing money on every customer it acquires, and metrics like CAC payback and LTV:CAC ratio are what expose that gap before it becomes a crisis.
Which SaaS metrics should every company track?
At minimum, track MRR, ARR, gross margin, customer churn rate, CAC, LTV:CAC ratio, and NRR. These seven cover revenue, profitability, acquisition efficiency, and retention, which together capture most of what determines whether a SaaS business is healthy.
How do you measure SaaS growth?
Growth is usually measured through MRR or ARR growth rate, but the healthiest way to evaluate it is alongside Rule of 40, since raw growth without margin discipline can mask an unsustainable spending pattern.
What is a good SaaS churn rate?
An annual logo churn rate under 5% is considered healthy for an established B2B SaaS company, though SMB focused products often run higher due to elevated business failure rates among their customers. Monthly churn in the 3 to 5% range is common across the broader market.
How do you calculate CAC and LTV?
CAC equals total sales and marketing spend divided by new customers acquired in the same period. LTV equals average revenue per account multiplied by gross margin percentage, divided by the monthly churn rate. Both should use fully loaded costs and margin adjusted revenue for an accurate read.
What is the Rule of 40 in SaaS?
The Rule of 40 states that a healthy SaaS company’s revenue growth rate plus profit margin should add up to 40% or more. The median B2B SaaS company scored around 25% in 2025, so hitting 40% currently puts a company in the top tier of the market.
What is a good Net Revenue Retention (NRR)?
NRR in the 100 to 108% range is roughly the current market median, while figures above 115 to 120% are considered strong and typically correlate with premium valuation multiples. NRR below 100% means the existing customer base is shrinking even before counting new sales.
Why is Net Promoter Score important for SaaS?
NPS is a fast, consistent way to track customer loyalty over time, and it correlates with churn and expansion revenue. Companies with NPS scores above 50 frequently report meaningfully lower annual churn than the broader market average.
Which SaaS metrics do investors care about?
In 2026, investors weigh NRR, CAC payback period, LTV:CAC ratio, and Rule of 40 most heavily, since these four capture growth efficiency and retention quality rather than just top line growth. A company that scores well across all four is generally treated as a more durable, more fundable business than one growing fast on a single metric alone.
Conclusion
Tracking SaaS metrics is more than measuring performance. It helps you understand what’s driving growth, where revenue is leaking, and which areas need attention. While all 16 metrics provide valuable insights, the most important ones will depend on your business stage, pricing model, and growth goals.
Build a dashboard around the KPIs that matter most, review them consistently, and compare your performance against relevant industry benchmarks. By turning these insights into action, you can improve customer retention, optimize acquisition costs, increase recurring revenue, and build a stronger, more sustainable SaaS business over time.